HOW TO READ THIS DOCUMENT
Part I of this series made the historical and diagnostic case: a 2015 CNA tabletop exercise modeled the mechanics of a fertilizer-fuel-food shock that the United States is now living through, and its single most important finding – that institutions relax the moment pressure eases, only to be caught flat by the next shock – is the organizing risk for the next 12–18 months.
Part II is different by design. It is not meant to be read once and filed away. It is a tracker product: a living document meant to be reissued on a recurring cadence – quarterly, at minimum, and sooner if a material shift occurs (a Hormuz ceasefire that actually holds, a formal El Niño peak declaration, a farm-bill or SNAP legislative change) – so that CommandEleven Intelligence’s readers have one place to check where the household outlook and the policy roadmap actually stand against what was projected.
Every dated figure below carries it’s as-of date. When this document is reissued, prior figures should be struck through or moved into a running “Tracker History” appendix rather than silently overwritten, so a reader can see the trendline, not just the latest snapshot – the same discipline the FAO Food Price Index and USDA’s WASDE reports themselves apply, and the discipline this paper argued in Part I that US institutions need to adopt more broadly.
THE HOUSEHOLD OUTLOOK, 12–18 MONTHS FORWARD
Baseline conditions as of this edition (Q4 2026)
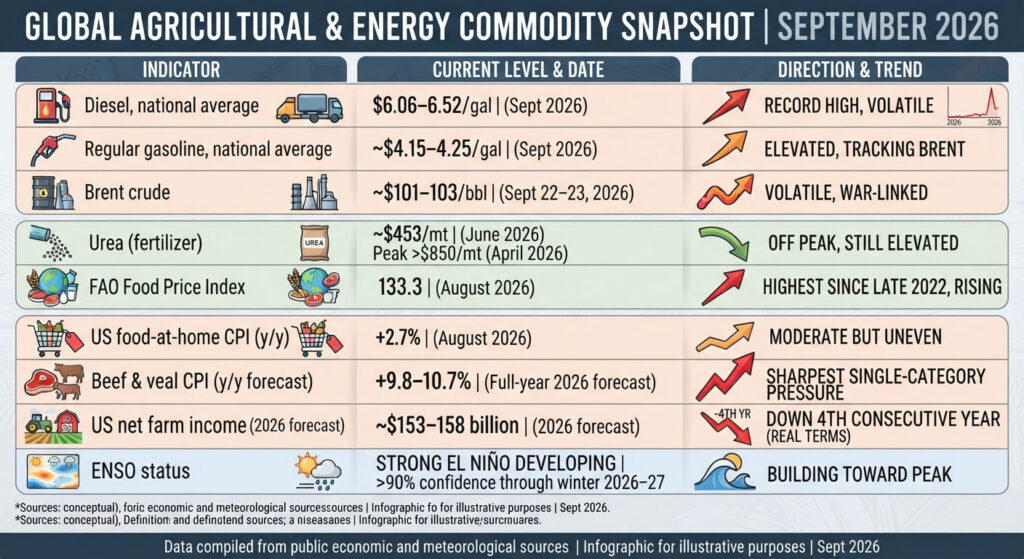
The three-layer outlook

- Layer 1 – The Iran/Hormuz layer (now through roughly Q2 2027) – This is the layer already partially priced into diesel, fertilizer, and shipping-insurance costs. Expect continued volatility rather than a clean trend: oil and fertilizer prices will spike on renewed strikes or Iranian rhetoric and ease on ceasefire talk, in a pattern that has now repeated at least half a dozen times since February 2026. A durable reopening of the Strait would compress this layer’s contribution to household costs materially – but even then, expect a lag of months, not days, between a ceasefire holding and diesel/fertilizer prices normalizing, because shipping insurance, refinery restart timelines, and Qatari/Iranian production-facility repair all move slower than a diplomatic announcement.
- Layer 2 – The structural farm-economy layer (12–24 months, largely independent of the war) – The US cattle herd is at roughly its smallest size in 75 years. Rebuilding a herd is a multi-year biological process – USDA’s own current forecast has beef prices rising again in 2027 regardless of what happens in the Gulf. This layer will not resolve on the same timeline as Layer 1, and households should not expect beef prices in particular to track any Hormuz ceasefire news.
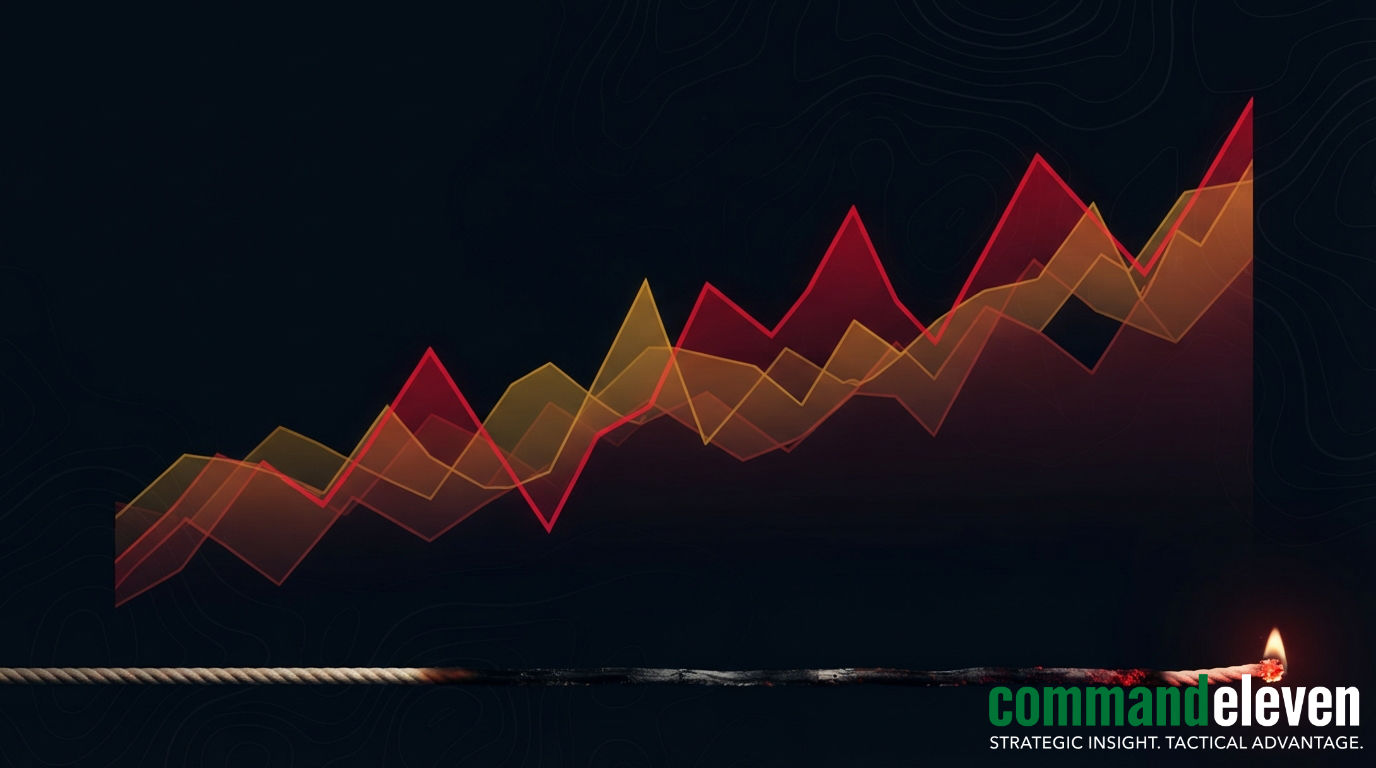
- Layer 3 – The El Niño layer (arriving through 2027, likely peaking in effect during the year) – NOAA’s own framing is explicit: El Niño’s global temperature and agricultural effects are typically strongest in the event’s second year. A very strong event now building through winter 2026–27 means the heaviest pressure on globally-traded commodities – sugar, vegetable oils, select cereals, coffee – is more likely to show up in 2027 than in the current quarter. This is the layer least connected to US domestic or Iran-war policy, and the one most likely to catch households and even some policymakers by surprise if Layer 1 (the war) has cooled by then and attention has moved on – precisely the “institutional relaxation” failure mode Part I identified as the central risk.
- Net read – a household should plan for elevated and uneven food and fuel costs through at least Q2–Q4 2027, not a short-term spike followed by a return to 2024-era pricing. The most likely single surprise, if there is one, is a second price wave in 2027 driven by El Niño rather than by the war – arriving at a point when public and media attention to the Iran conflict may have already faded.
Category-level detail for household budgeting
- Beef and other red meat: Sustained pressure through 2027 on structural (herd-size) grounds, independent of the war. Plan for this as a durable cost increase, not a temporary spike
- Poultry, pork, eggs: Comparatively stable to declining; the lowest-friction substitution category for households looking to offset beef-driven grocery inflation
- Grains, cereals, vegetable oils: Currently rising on both Black Sea and Hormuz disruption; carries the highest exposure to the incoming El Niño layer given historical Indian-monsoon and Southeast Asian production sensitivity
- Sugar: The single sharpest FAO sub-index mover in the most recent reading (+11.9% month-on-month in August 2026), driven by EU weather, Brazilian production, and El Niño concern – worth watching as an early indicator of how hard the El Niño layer is actually biting, since sugar-producing regions are among the most exposed
- Dairy: Modestly rising on EU supply tightness; less exposed to the Hormuz/Iran layer directly
- Fuel (transportation pass-through): The most volatile, headline-sensitive category; drives delivered cost of nearly everything else on this list through freight, so a diesel spike shows up in grocery prices with a lag of roughly 4–8 weeks in most supply chains
Household stopgaps – carried forward and refined from Part I
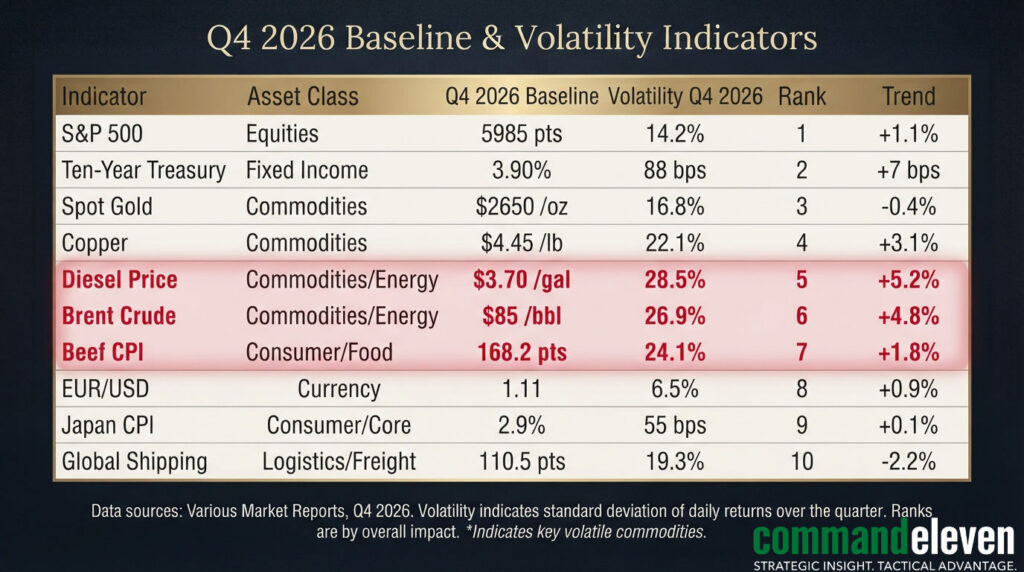
These remain the core recommendations; refinements below reflect this edition’s data.
- Budget to the range, not the latest number – Given the volatility documented in Layer 1, a household budgeting off last week’s diesel or gas price will be repeatedly wrong in both directions. Use a rolling 3-month average
- Make the beef substitution decision now, not reactively – Because Layer 2 (herd rebuild) is structural and multi-year, this is not a “wait it out” category. Planning 1–2 fewer beef-centered meals per week captures durable savings
- Treat sugar, vegetable oil, and select cereal purchases as your El Niño early-warning aisle – If these categories are the ones moving fastest in your own grocery bill over the coming two quarters, that is a household-level signal that Layer 3 has arrived ahead of the broader narrative catching up – worth adjusting the shelf-stable stockpile recommendation toward these specific categories
- Re-check SNAP/WIC eligibility at each quarterly update of this tracker, not just once – eligibility thresholds and a household’s own income can shift, and benefit-level policy may change at the “6 month” or “9 month” administration checkpoints below.
- Batch and plan fuel-intensive trips, especially around known volatility triggers (Iran ceasefire talks, OPEC+ meetings, Hormuz incident reports) rather than assuming a stable price environment week to week
- Revisit this stopgap list at the next quarterly edition – A recommendation that made sense in Q4 2026 (e.g., front-loading shelf-stable staples) may be less relevant once the immediate Hormuz volatility has priced in and the marginal risk shifts toward Layer 3
THE ADMINISTRATION ROADMAP: NOW / 6 MONTHS / 9 MONTHS
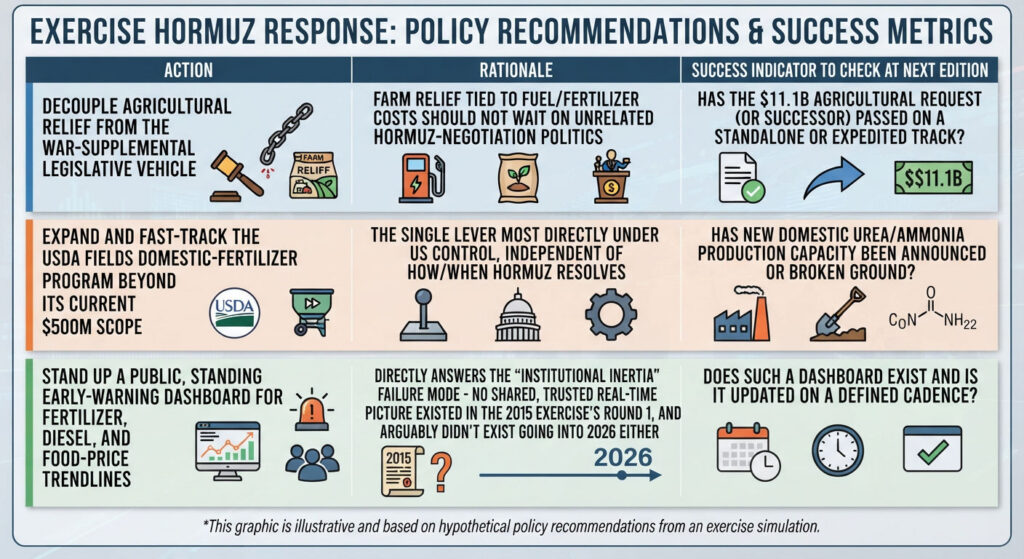
This carries forward Part I’s roadmap in expanded form, with explicit success indicators so that each future quarterly edition of this tracker can score whether each milestone was actually met – the accountability mechanism Part I argued was itself the missing piece in how the 2002 *Millennium Challenge* and 2015 *Food Chain Reaction* institutional lessons were (or weren’t) absorbed.
NOW (Q4 2026 / October–November 2026)
SIX MONTHS (Q1–Q2 2027 / March–April 2027)
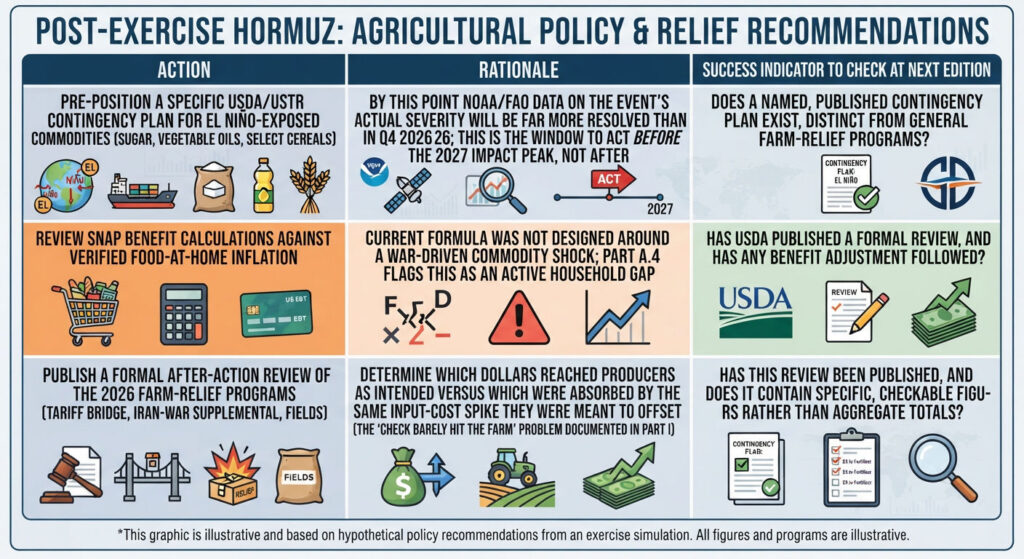
NINE MONTHS (Q2–Q3 2027 / June–July 2027)
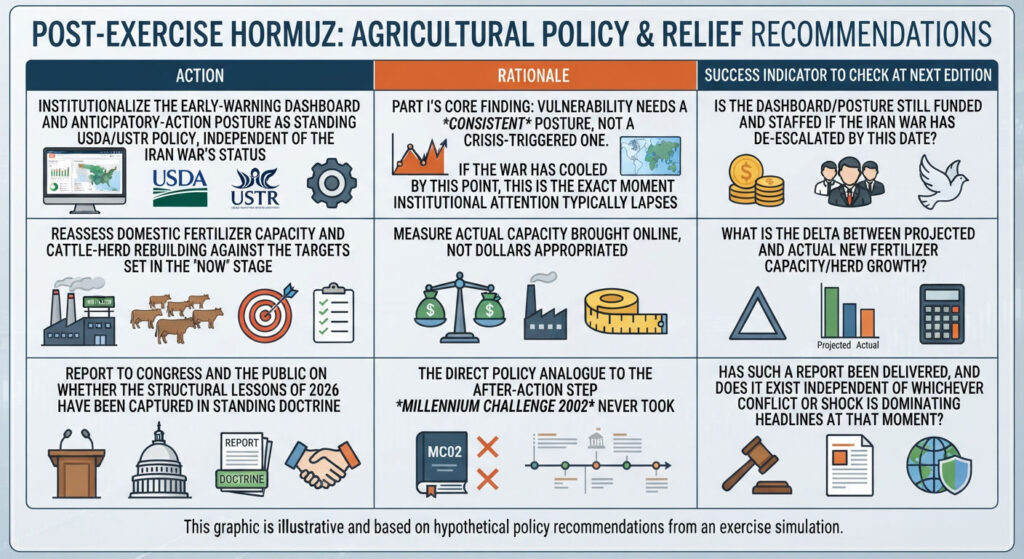
The test this roadmap is actually designed to pass
None of the three checkpoints above are primarily about the Iran war or El Niño resolving. They are about whether the systems built in response to the 2026 shock are still standing, funded, and staffed nine months later, regardless of whether the news cycle has moved on. That is the specific, falsifiable version of the “institutional inertia” lesson from Part I, and it is the single line item every future quarterly edition of this tracker should evaluate first.
WHAT TO WATCH BETWEEN NOW AND THE NEXT EDITION
A short, dated checklist of the specific releases and events most likely to move the picture before this tracker’s next scheduled update:
- USDA WASDE / Crop Production reports – next release cadence per USDA calendar; watch for corn/soybean yield revisions and any early 2027 planting-intentions signals
- USDA Farm Sector Income Forecast – next update (per USDA’s own schedule, roughly early December 2026) will be the first full read on whether the farm-income decline is stabilizing or deepening
- FAO Food Price Index – released monthly; watch specifically the Sugar and Cereal sub-indices as the earliest readable signal of the El Niño layer arriving
- NOAA ENSO Diagnostic Discussion – released monthly (second Thursday); watch for the transition from “strengthening” to “peak” language, which historically precedes the sharpest agricultural impacts
- AAA/GasBuddy diesel tracking – watch for a sustained (not single-week) reversal below $5.50/gal as the first real signal that Layer 1 pricing pressure is genuinely easing rather than pausing
- Congressional action on the Iran-war supplemental and the $11.1B agricultural request – status directly determines whether B.1’s first roadmap item has been met
- Any formal Strait of Hormuz reopening or safe-passage agreement – and specifically whether shipping insurers and fertilizer producers (Qatar, Iran) resume normal throughput, not just whether a ceasefire is announced
TRACKER HISTORY
(This section will accumulate with each quarterly edition, preserving prior baseline figures for trend comparison rather than overwriting them.)
- Q4 2026 (this edition): Initial baseline established
This is Part II of the “Food Chain Reaction Revisited” series. See Part I for the historical and diagnostic foundation – the 2015 CNA exercise, its findings, and the sector-by-sector mapping against the 2026 crisis.
Sources:
- USDA ERS Food Price Outlook and Farm Sector Income Forecast
- USDA WASDE (Sept. 2026)
- US Bureau of Labor Statistics CPI (Aug. 2026)
- FAO Food Price Index (Aug. 2026)
- FAO–WFP Joint Anticipatory Action Appeal
- NOAA Climate Prediction Center ENSO Diagnostic Discussion (Sept. 2026)
- AAA Daily Fuel Gauge
- World Bank and WTO fertilizer/Hormuz trade analysis
- American Farm Bureau Federation
- Farm Aid
- CSIS
- Congressional correspondence on fertilizer/Iran war impacts